
Modeling physiological response during incremental exercise protocol
- Using [LA] as dependent variable and P (W) or v (m/s) as independent variable
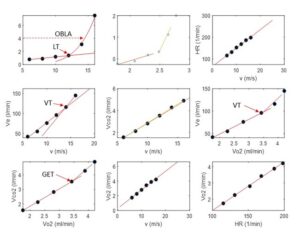
- LACTATE THRESHOLD (Beaver , Usaj Starc Int J Sports Med, Usaj, Kandare ). The model used primary linearization of data by logaritmization of LA values separately in estimated low slope phase and steeper phase. By calculating the intersection point of two, the best fitting lines, now in logarithmic scale, LT was estimated. The final step is antilogaritmization for transforming to initial [LA] vs P (W) or [LA] vs v (m/s) diagram (Figure at page 1). The computer programs for calculation of LT are developed by MATLAB.
- ONSET OF BLOOD LACTATE ACCUMULATION (Sjodin …). The criterion use fixed [LA] = 4 mmol/l as criterion. The computer program developed in MATLAB calculated corresponding: P (W), v (m/s), HR (min-1), Vo2 (l/min).
- Using VE as dependent variable and P (W) or v (m/s) as independent variable.
- VENTILATORY THRESHOLD (VT) ( xxxx). Model used intersection point of two, best fitted interpolating lines at threshold. Computer program (MATLAB) calculated corresponding: P (W), v (m/s), HR (min-1), Vo2 (l/min).
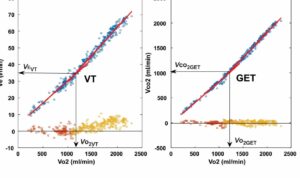
- Using Ve or Vco2 as dependent variable and Vo2 as independent variable
- VENTILATORY THRESHOLD (VT) (xxx). Model used the same criterion as previously presented VT.
- GAS EXCHANGE THRESHOLD (GET) (originally determined as ANAEROBIC THRESHOLD by Wasserman ). Criterion used the intersection point of two, best fitted interpolating lines at threshold. Computer program (MATLAB) calculated corresponding: P (W), v (m/s), HR (min-1), Vo2 (l/min).
Similarly, as already presented different thresholds criterion, the muscle oxygenation during incremental testing protocol also show a threshold phenomenon, which can be used for determine Muscle Oxygenation Threshold. This research topic si under progress, presently.
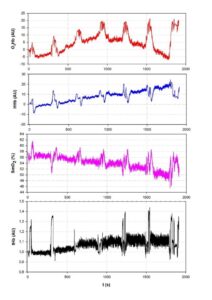
Another version of determining all thresholds at incremental testing protocol (example from running on treadmill) when gas exchange and ventilatory parameters corresponding to particular intensity were calculated by averaging measured values (breath-by-breath) and averaging during last 30 s of every step.
In spite the incremental testing protocol is used for determing threshold values, the important aim of the test is to estimating maximal values of aerobic power, which is represented by Vo2max. For this purpose, test must be specifically constructed, to enable reaching individual maximal criteria for Vo2max. Namely, the test characteristics for determing more precisely thresholds need longer time intervals for each step (usually 3-5 min). Namely thresholds values are time sensitive. These incremental tests are longer and it is frequently happens that individuals, in spite that are trained, must end the test due fatigue before it reach Vo2max. Therefore, adequate testing protocols for reaching Vo2max need less time for every step (1-3 min). In Exercise Physiology the compromise between presented needs is reach in 3 min steps. However in Sport Physiology, the interval must be selected to reach specific needs of certain sports discipline.
Four typical thresholds obtained from incremental testing protocol determines submaximal exercise performance valid for estimation of endurance performance. Nevertheles, their values are limited for this purpose. Namely, endurance performance has et list one another dimension. This is duration of exercise, which can be performed at intensity determined by specific threshold intensity. This dimension can’t be estimated by using incremental testing. Therefore, another and additional kind of testing needs to be applied for more complex and precise estimation of endurance performance.
Modeling physiological response during one step exercise protocol
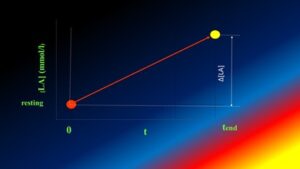
Advantage of this kind of testing represent possibility for precise analysis of time course (kinetics) of characteristics of interest and observing their interaction during unchanged or even changed exercise intensity. The most typical phenomenon related to kinetics is steady state. At the beginning of this paragraph the lactate steady state (LAss) and pH steady state (pHss) were mentioned. The steady state phenomenon can be easily ascertain by using linear interpolation using least square method and the model:
![]()
where is [LA] in time t , t1 is initial [LA] calculated as constant and b slope coefficient and t increases from beginning of exercise to the end. To observe steady state b coefficient or the rate of the equation must be 0 or within limits that still valid as steady state:
![]()
Therefore, the [LA]t1was repeated throughout the test due to fact that is constant in the case of steady state.
The next typical kinetics was presented by time course of gases O2 and CO2 and ventilation. Vo2 kinetics is presented by using two or three phases. The two phases model which show two Vo2 kinetics of different amplitudes of Vo2 increase is presented in the chapter of Oxygen uptake and muscle oxygenation. In both examples, the Vo2 kinetics is represented by a two exponential rise to maximum curves:
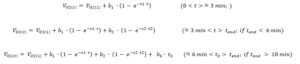
By the third part of the equation (linear part) it is estimating possible Vo2 drift or unsteady state part, which occur during moderate exercise intensities but with longer exercise time or higher exercise intensities.
All these models not include the initial, cardiodynamic phase, which occur usually in exercise, starting from basal metabolism and without warm up. However, sport exercises are regularly preceed by warm up. In this cases, the initial Vo2 is not nearby resting values (0.25-0.4 L∙min-1) but at the level, which was influence by warm up (1-2 L∙min-1). This is very important in estimating warm up influence on gas exchange and ventilation during following exercise. Namely, both oxygen kinetic phases seems to be shorter and amplitude is smaller due to higher initial (starting) values. This may reduce oxygen deficit.
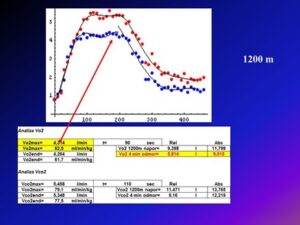
One step testing is the only testing protocol, which simulate competition conditions. This simulation is, when reflects competition or maximal performance, uses a different design than a typical one step test. Namely starting acceleration need to be precisely simulated as well as small, but important intensity fluctuations of exercise intensity and organism responses during rest of the simulation, until finish. The the modelling of 400 m and 1200 m maximal running tests of one trained runner were presented on figures below. The first test estimated maximal anaerobic lactate powewr (ANLAP) or speed – endurance, but due to warm up, even Vo2 increased rapidly to close to maximal values during a minute of run. On the other, 1200 m modelling The Vo2 and Vco2 fluctuations at Vo2max values showed complex gas exchange during such testing.
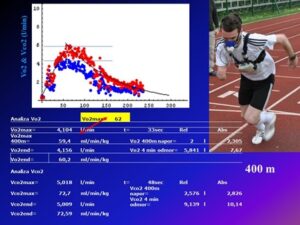
As 400 m test represent an estimation of predominance of anaerobic processes in energy release it is using for estimating ANLAp during maximal exercise by using formula:
![]()
or
By using calculation of AMLAp energetic equivalent may also be calculated by:
![]()